Discord
Try the analytics engine that powers Gateway -- free, no install, just a Discord invite. Run any of eight slash commands on any OPRA-listed ticker and the bot returns a chart or table generated by the same Greeks engine you'd run locally with Gateway.
Free for everyone
Every member gets 100 commands per day, free -- no credit card, no paid tier, no upgrade. Hit the limit and the bot just asks you to come back tomorrow.
Quick reference
Eight commands grouped by what they show. Click any to jump to its details.
-
Vols and Greeks for a single option contract.
-
Risk-free rate, implied borrow, cumulative dividends per expiry.
-
Volatility skew across strikes for a chosen expiry.
-
Term structure of vol -- vol vs tenor at a chosen delta.
-
Full 3D vol surface across strike × expiry.
-
Any metric across multiple deltas and multiple expiries.
-
Two underlyings overlaid -- ETF vs index, sister mega-caps.
-
Lavender's American Greeks vs the Black-Scholes equivalent.
Interactive buttons
Every response carries a row of navigation buttons below the chart -- jump to a different expiry, flip between calls and puts, or pivot to the related skew / term / surface view without retyping the command.
Single contract
A single option, fully resolved -- the smallest unit the bot serves.
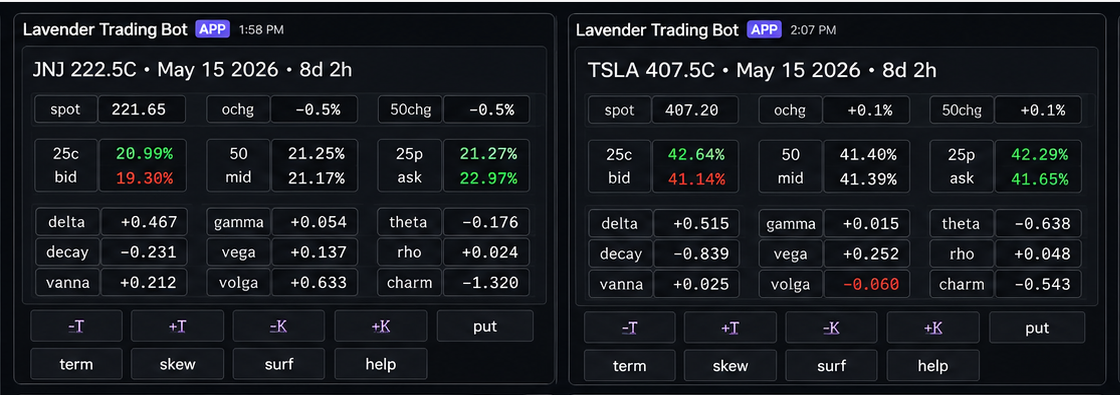
/greeks
Vols and Greeks for one option contract, with a one-line summary above the table.
| Parameter | Required | Description |
|---|---|---|
ticker |
✓ | Underlying symbol (e.g. TSLA, SPY). |
expiry |
14d, 30d, or YYYY-MM-DD. Defaults to the front month. |
|
strike |
Strike price. Defaults to the at-the-forward strike. | |
putcall |
Call or Put. Defaults to call. |
|
help |
Show field definitions instead of live values. |
Returns: a text embed titled {TICKER} {STRIKE}{C|P} • {Mon DD YYYY} • {N}d. The body is a compact 3×6 monospaced table. Top half shows vol context: spot, the contract's IV change since T-1, the ATM vol change since T-1; the 25Δ-call / 50Δ-ATM / 25Δ-put smile; bid/mid/ask IVs. Bottom half shows the Greeks: delta, gamma, theta, decay, vega, rho, vanna, volga, charm. Pass help:true to get a glossary embed instead of live values.
/rates
Risk-free rate, implied borrow cost, and cumulative dividends to each listed expiration -- the calibrated carry inputs feeding every other command.
| Parameter | Required | Description |
|---|---|---|
ticker |
✓ | Underlying symbol. |
Returns: a text-table embed titled {TICKER} • Rates • Funding & Carry, one row per listed expiration with seven columns: Expiry Date, Days→Expiry, Risk Free rate, Implied Borrow, Annual Carry, Sum of Divs, Fwd Price. Multi-root tickers (SPX+SPXW, NDX+NDXW, etc.) get an extra Root column so each root's per-expiry funding shows separately.
Volatility shapes
Three projections of the same vol surface. Each anchors to a different axis: skew slices it across strikes at one expiry, term slices across expiries at one delta, surf shows everything at once.
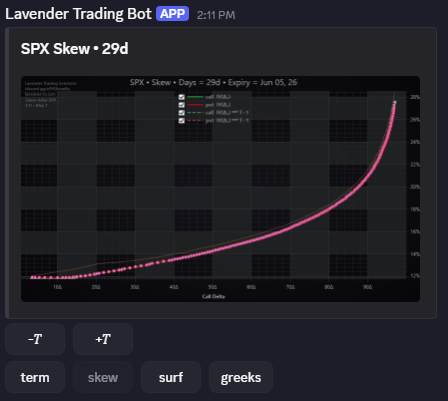
/skew
The volatility curve across strikes for a chosen expiry -- the classic skew chart.
| Parameter | Required | Description |
|---|---|---|
ticker |
✓ | Underlying symbol. |
expiry |
14d, 30d, or YYYY-MM-DD. |
Returns: vol on the y-axis, call delta on the x-axis, market quotes overlaid on Lavender's fitted curve.
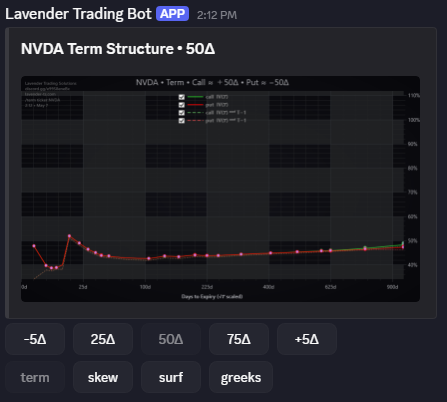
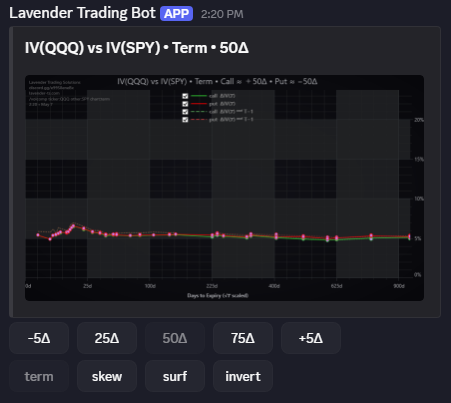
/term
Term structure of implied volatility -- vol on the y-axis, days-to-expiry on the x-axis -- with an optional highlight at a specific delta.
| Parameter | Required | Description |
|---|---|---|
ticker |
✓ | Underlying symbol. |
delta |
Highlight a specific delta on the curve (e.g. 25, -25). |
Returns: an ATM term curve with optional auxiliary curves at the requested delta, useful for spotting calendar-spread opportunities or earnings-driven kinks.
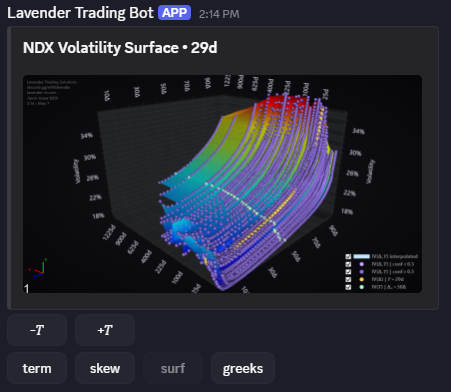
/surf
The full 3D implied-volatility surface (strike × expiry) for an underlying, rendered with proper perspective and contour shading.
| Parameter | Required | Description |
|---|---|---|
ticker |
✓ | Underlying symbol. |
expiry |
Highlight one expiry on the surface. |
Returns: a 3D wireframe / surface plot. Highlights any requested expiry as an emphasized contour. This is usually the first command worth showing a colleague.
Multi-axis
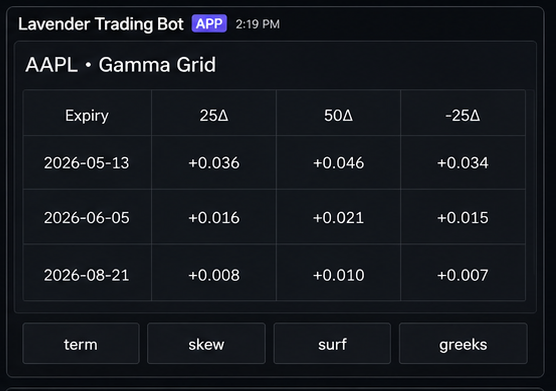
/grid
Tabular comparison of any single metric across a chosen list of deltas and expiries. Lets you scan vega across the term structure for several wings at once, or watch where gamma concentration shifts as the front month rolls forward.
| Parameter | Required | Description |
|---|---|---|
ticker |
✓ | Underlying symbol. |
metric |
iv (default), delta, gamma, theta, vega, vanna, volga, rho. |
|
expiries |
Comma-separated list (e.g. 14d,21d,2026-12-19). |
|
deltas |
Comma-separated list (e.g. 25,50,-50,-25). |
Returns: a code-fenced monospaced table titled {TICKER} • {Metric} Grid -- rows are expiries, columns are deltas. When unspecified, expiries defaults to every listed expiry and deltas defaults to 50,-50 (just the ATM call/put per row). Each cell shows the chosen metric for the option closest to that call-delta at that expiry. Plain text, no color shading.
Comparisons
Difference views. The chart plots one curve minus another, so the y-axis is the gap itself -- where it's near zero the two views agree, where it spikes the assumptions matter. Easier to read than overlaid curves once divergences get small.
/volcomp
The vol-curve difference between two underlyings. Useful for ETF vs underlying index, sister mega-caps, or sector vs leader -- whatever pair you want to track for relative-vol drift.
| Parameter | Required | Description |
|---|---|---|
ticker |
✓ | First underlying. |
other |
✓ | Second underlying. |
chart |
term, skew, or surf. Defaults to surf. |
|
expiry |
Used by skew / surf. |
|
delta |
Used by term. |
Returns: a single curve of ticker − other on the chosen chart axis. Positive where the first underlying's vol is higher; negative where it's lower. An Invert button on the response flips A and B so you don't need to re-run the command to flip the sign convention.
/bscomp
The difference between Lavender's American Greek and its Black-Scholes equivalent on the chosen chart -- the fastest way to see where simplified assumptions cost you. The gap typically widens near ex-dates, on deep ITM contracts, and in hard-to-borrow names.
| Parameter | Required | Description |
|---|---|---|
ticker |
✓ | Underlying symbol. |
chart |
term, skew, or surf. Defaults to surf. |
|
metric |
delta (default), gamma, vega, theta, rho. |
|
expiry |
Used by skew / surf. |
|
delta |
Used by term. |
Returns: a single curve of American − Black-Scholes for the chosen metric. Where it stays near zero the two models agree; where it spikes (typically around ex-dates and in deep ITM territory) is where the early-exercise (American) adjustment matters and the simplified model is wrong.
Once you've outgrown the bot
Discord is for ad-hoc lookups. When you need Greeks programmatically -- backtesting, live hedging, building tools on top of an options-analytics engine -- run Gateway. Same engine, same math, REST instead of slash commands, no daily limit.